Passenger information system for events
Live vehicle tracking and real arrival predictions for multi-day events, covering hotels, parking, venues, and more. Your attendees scan a code and see their shuttle. Your operations team sees everything moving: shuttles, luggage trucks, road crew, even participants on course. Contract for a single event: no annual licence; nothing to renew.
The problem
At a multi-origin event, attendees stand on a curb with no idea whether the shuttle left two minutes ago or twenty. They call the front desk. The front desk calls you. Someone decides to drive instead — and now your parking plan is wrong too.
Meanwhile your dispatcher is working from radio chatter and a group text, with no way to see that three vehicles on the same route just bunched at the venue while people wait across town.
One long unexplained wait, and people stop trusting the shuttle for the rest of the event — and start driving.
When the start line closes at a fixed hour, a missed shuttle isn’t an inconvenience — it’s a missed event.
Without data, next year’s plan is built on the same guesses as this year’s.
Passenger experience
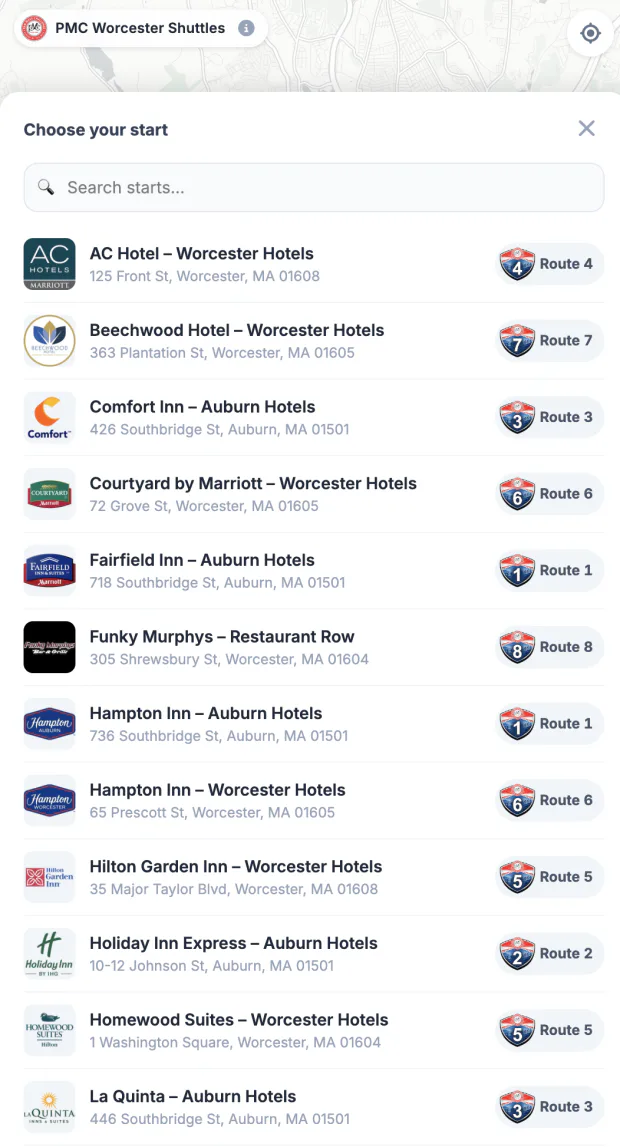
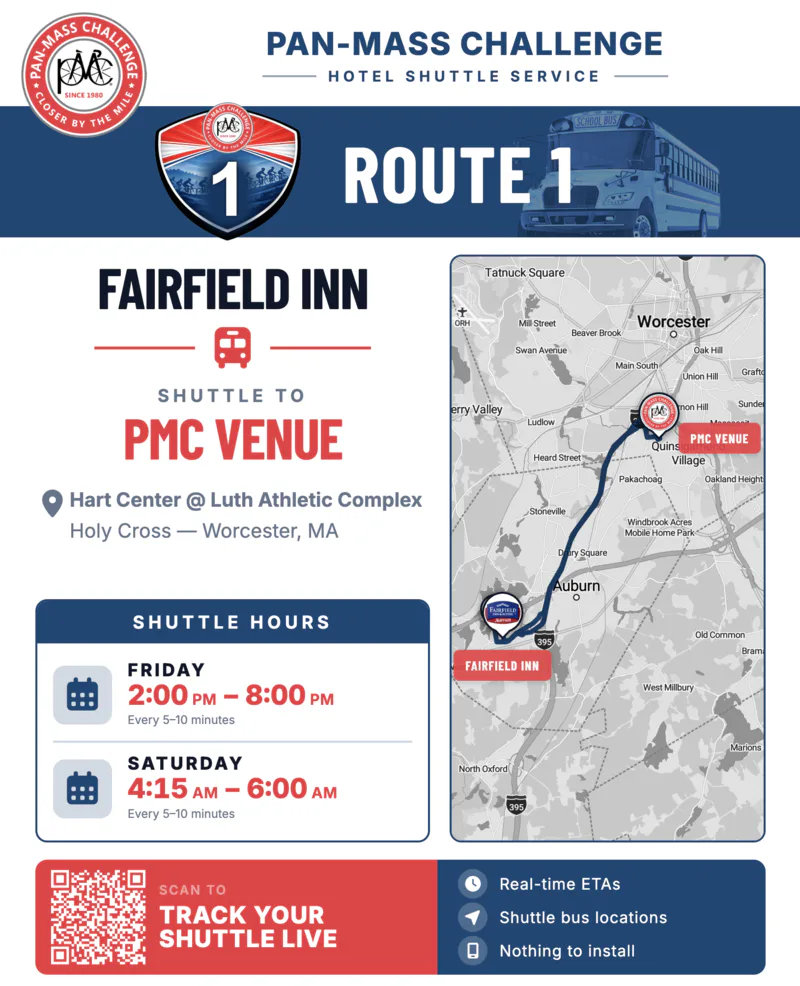
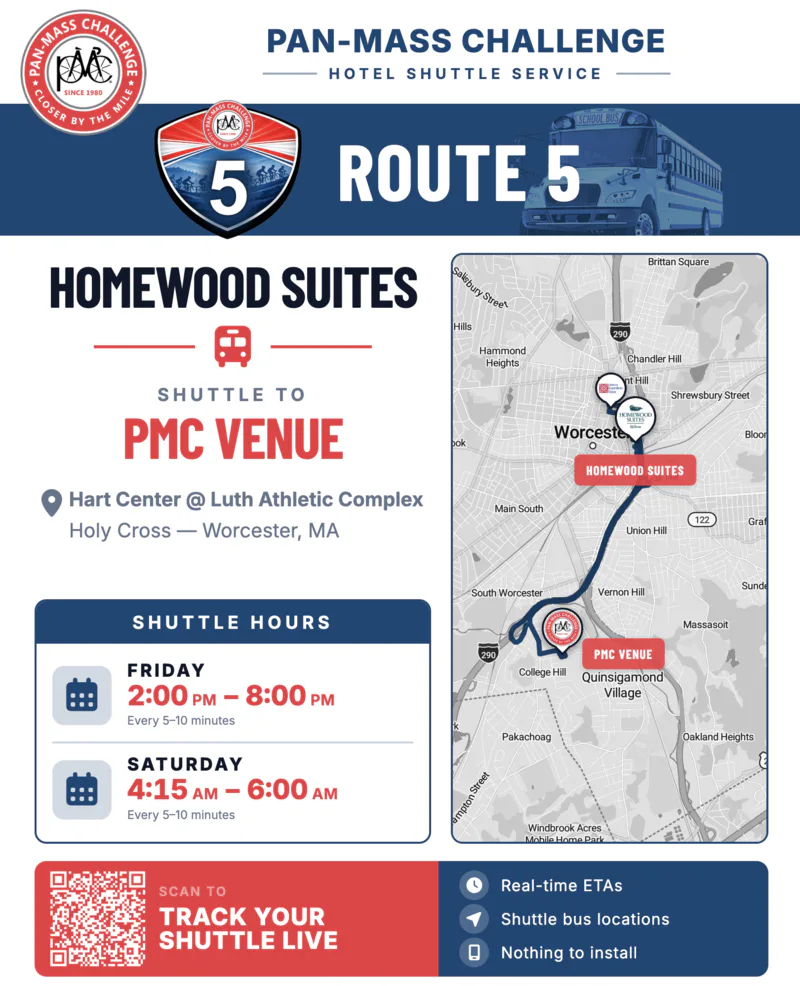
A progressive web app — no download, no account, no app store review. Print the QR code on signage and each code opens directly to that stop’s route, already selected.
Operations
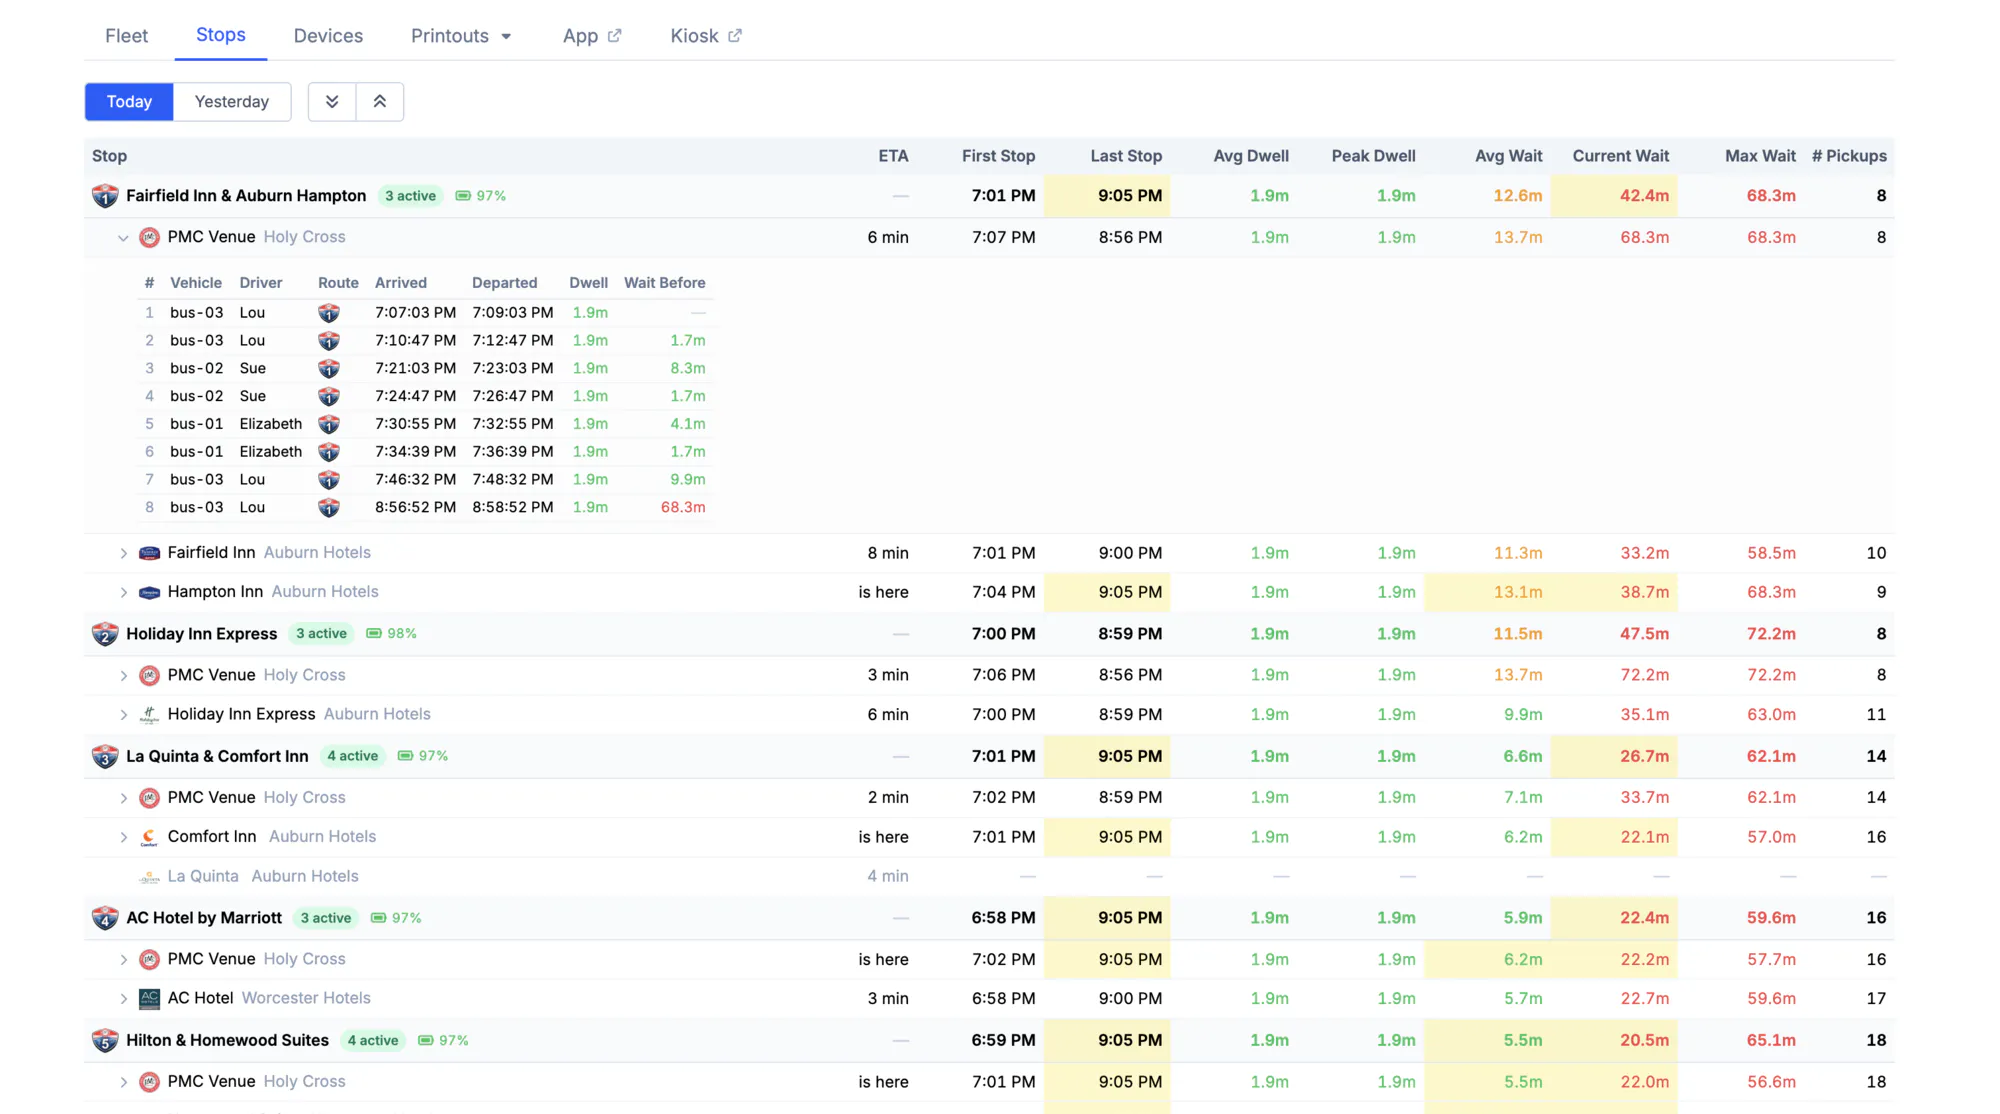
Define your routes once. The passenger app, the dispatch console, the lobby displays, the driver handbooks and the crew schedules all come from the same configuration — so they can’t drift apart at 5 a.m. on event day.
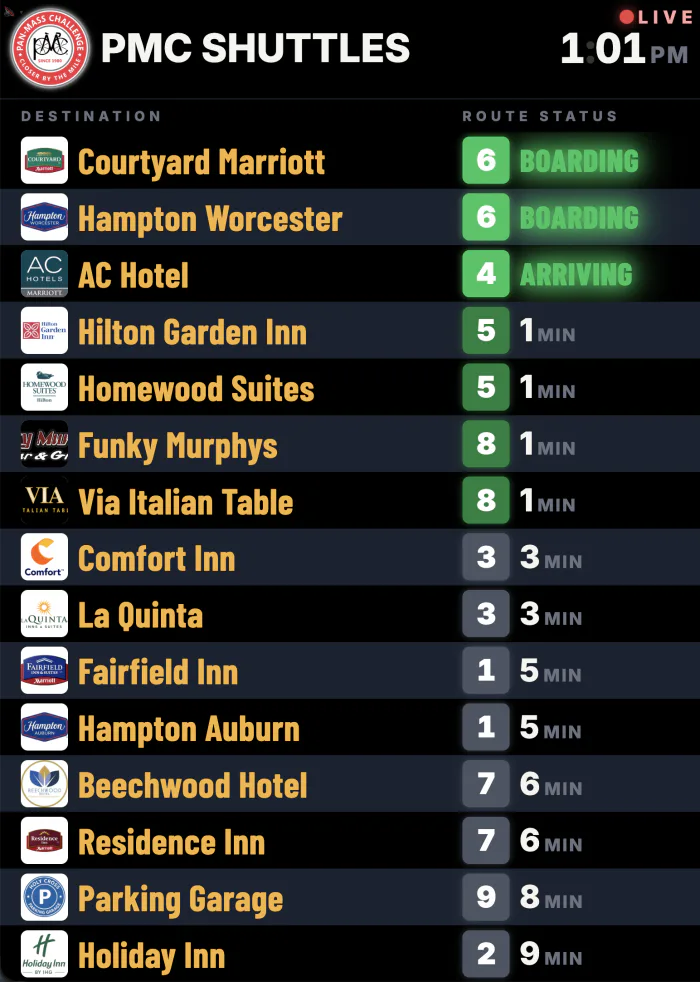
Point a screen at the display URL and it runs itself — no app, no operator, no refreshing. Every destination the venue serves is ranked by who leaves next, and arrivals are announced aloud, so a departing rider can read one line or simply listen and know where to stand.
Per-driver, per-day printed run sheets with stop order, timings and maps — generated, not hand-assembled in a spreadsheet the night before.
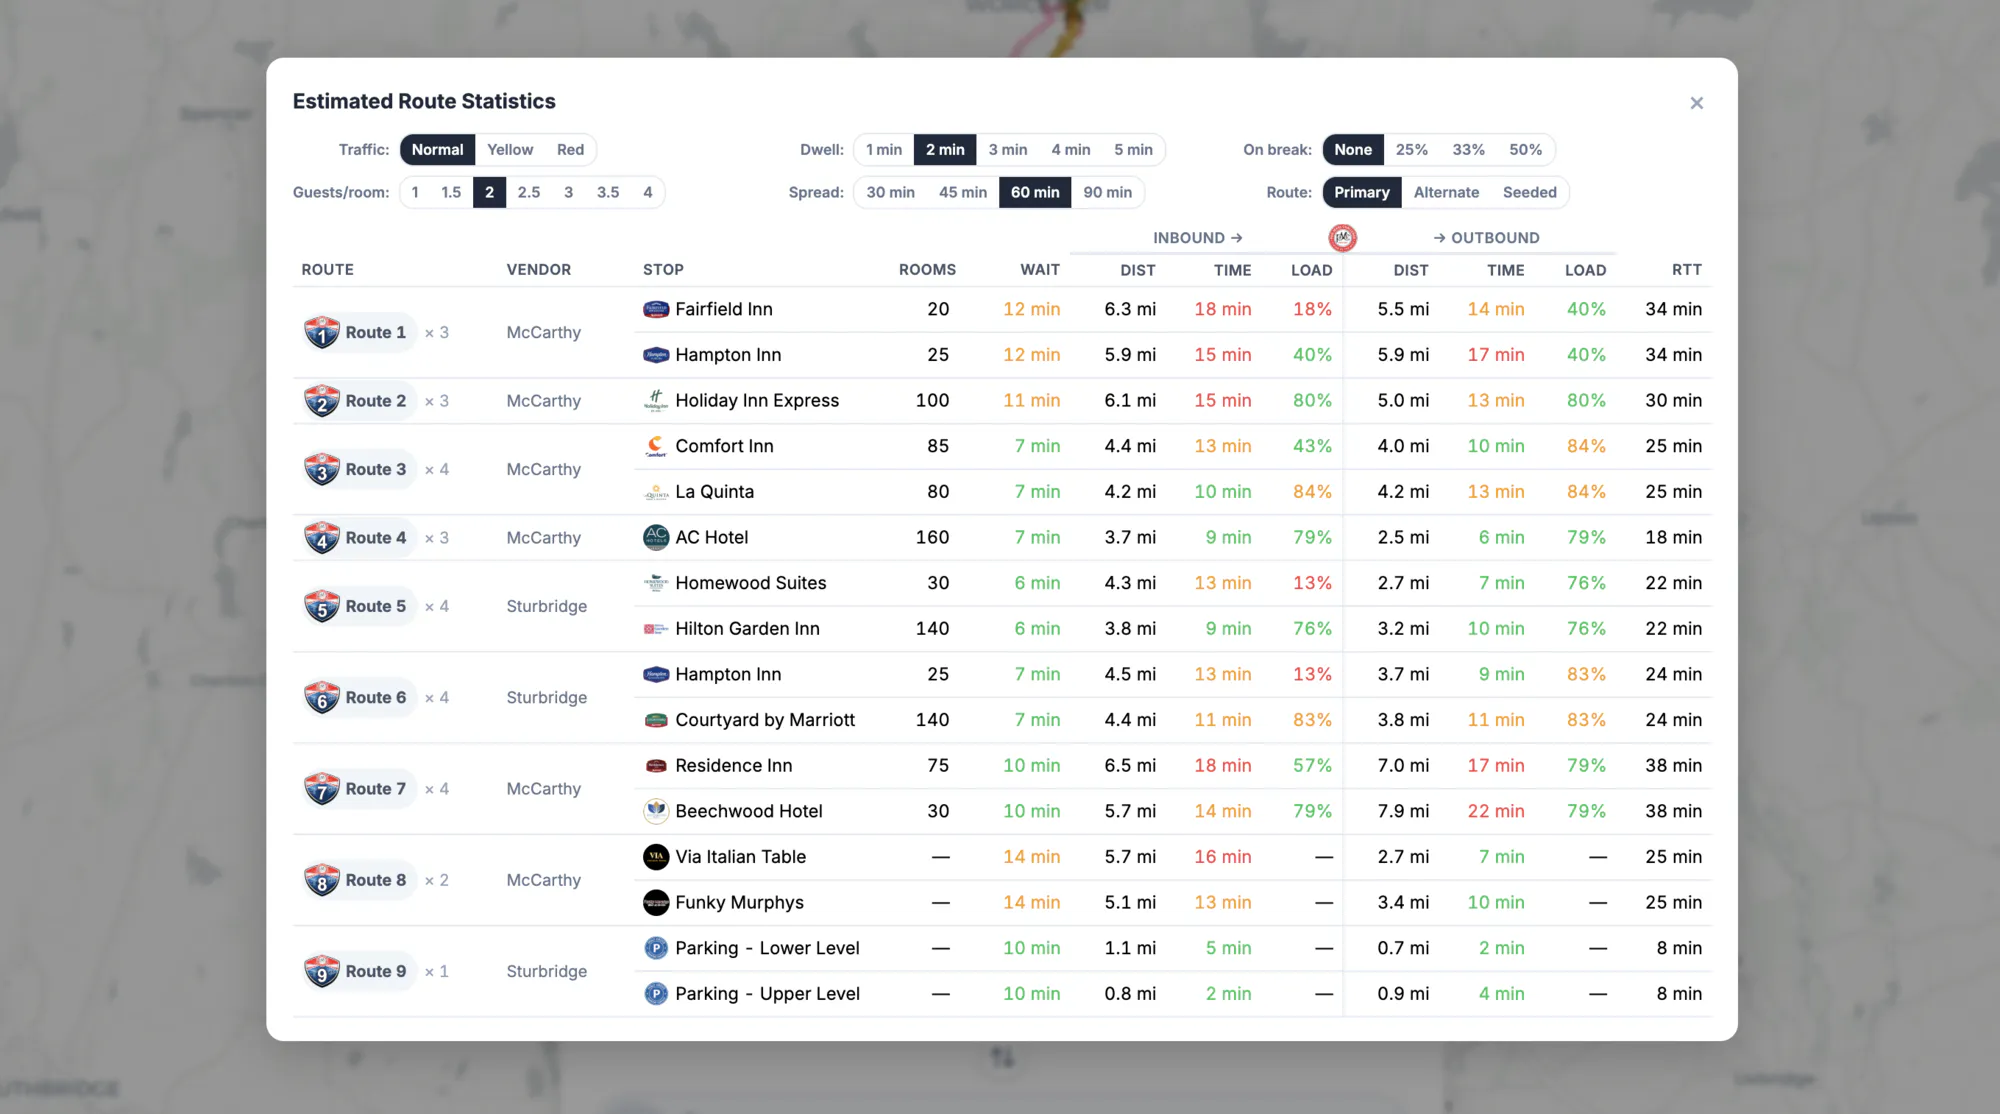
Stress-test a route plan before the event. Add vehicles, change headways, and see what passengers would experience — so staffing decisions are made on evidence.
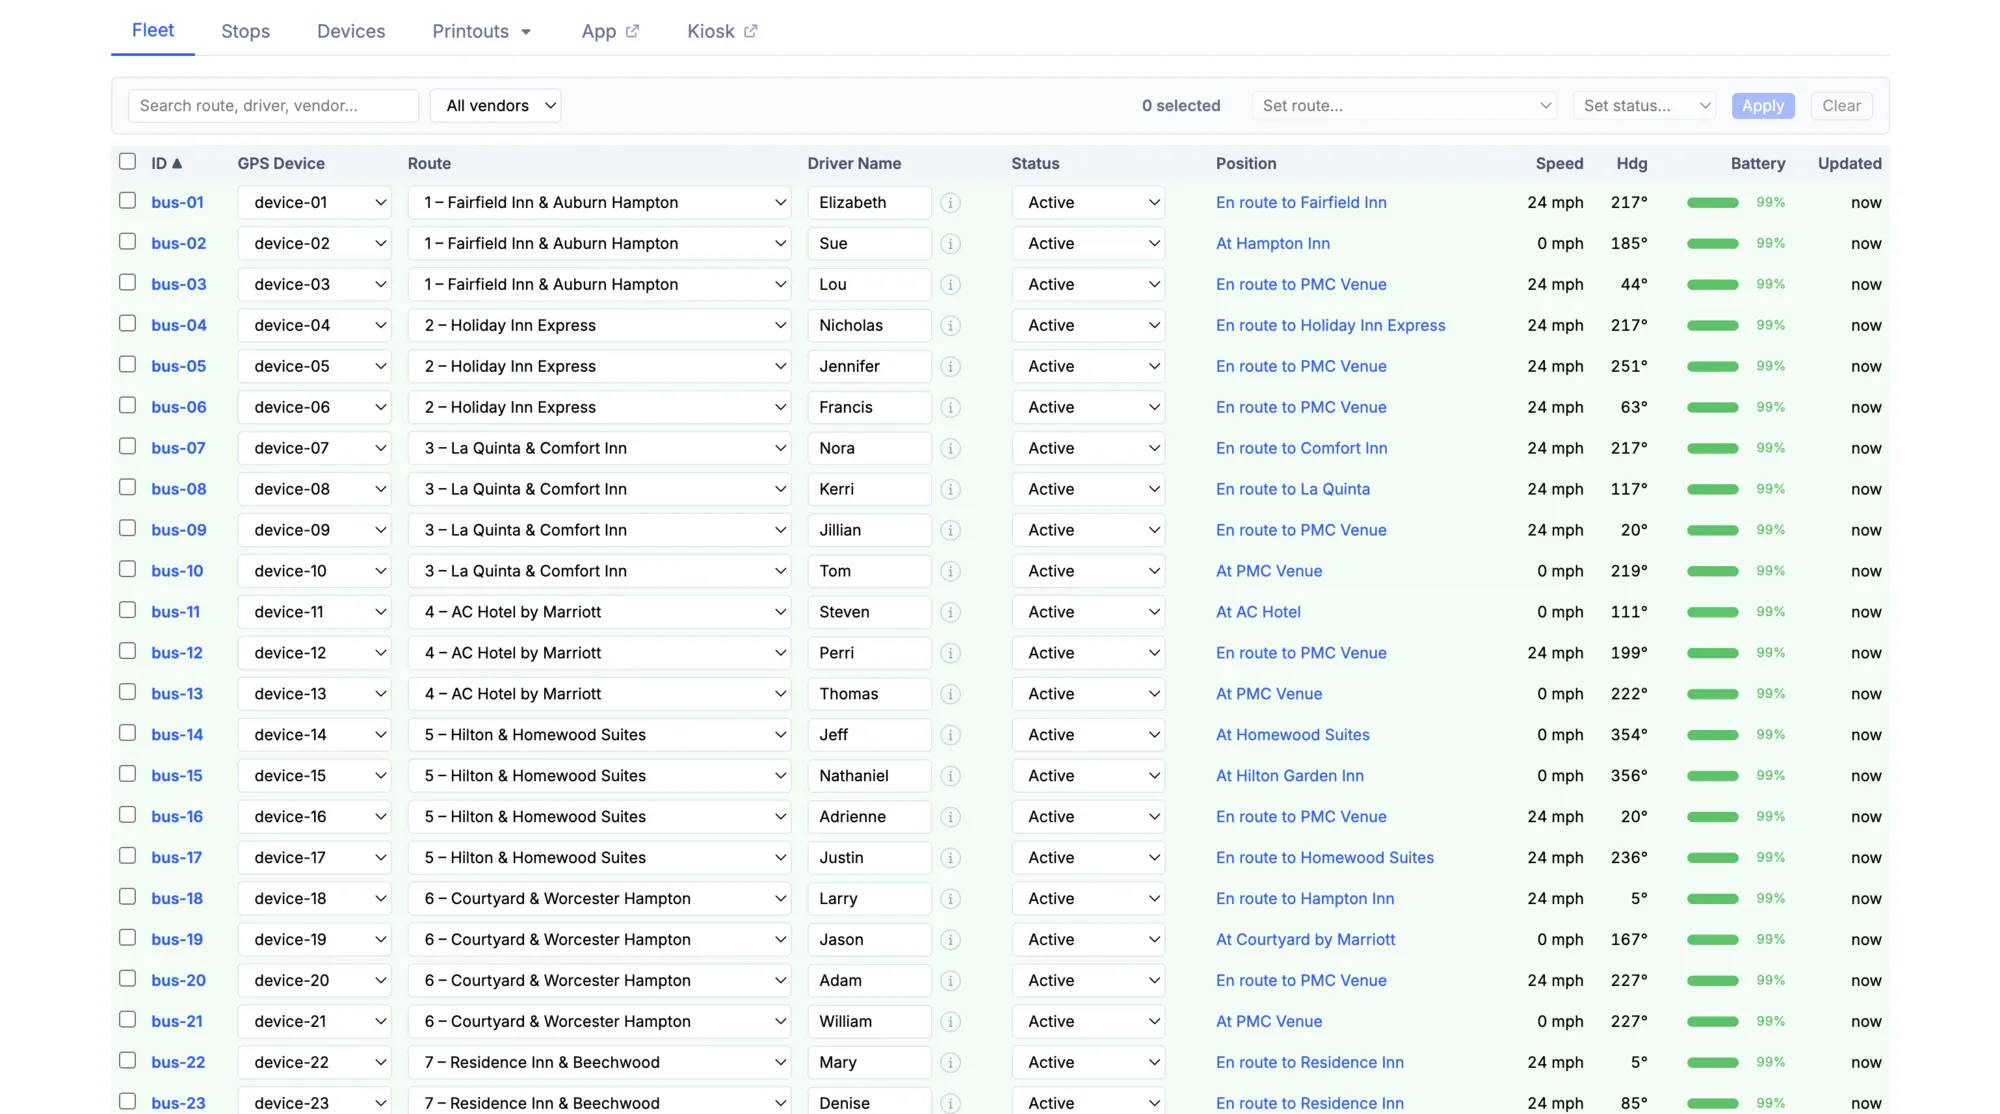
Every tracker reports its own charge and last fix. You find out a unit is fading with hours to spare, not when a vehicle silently drops off the map.
Anything that moves at your event can carry a tracker, and anything carrying a tracker can have an ETA. The same map, the same dispatch console and the same after-action report cover all of it — you are not buying a shuttle tool and then a second tool for everything else.
Analytics & after-action reporting
Most shuttle debriefs are anecdote — the one complaint someone remembers, the route a volunteer thought was busy. Every position from every vehicle is retained and analysed, so the debrief is measured instead: what each group actually experienced, where the fleet was under-used, and which changes would move the needle next year.
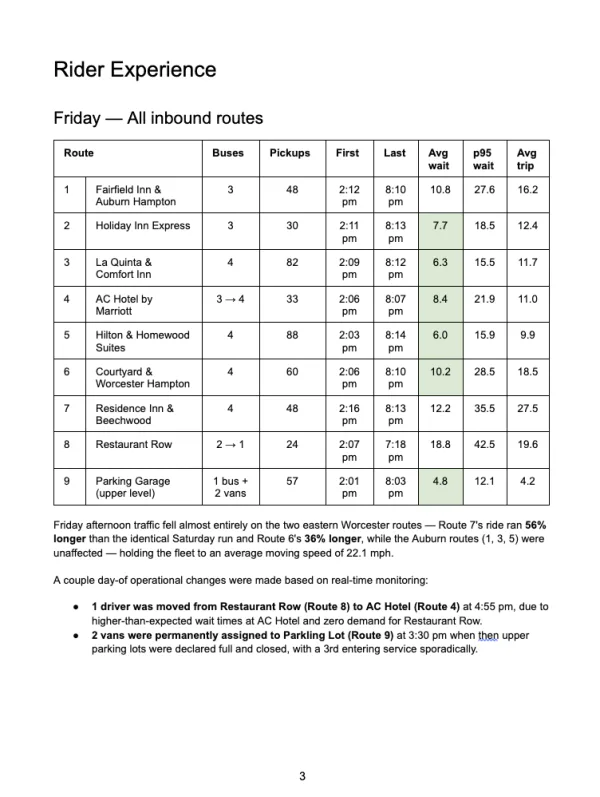
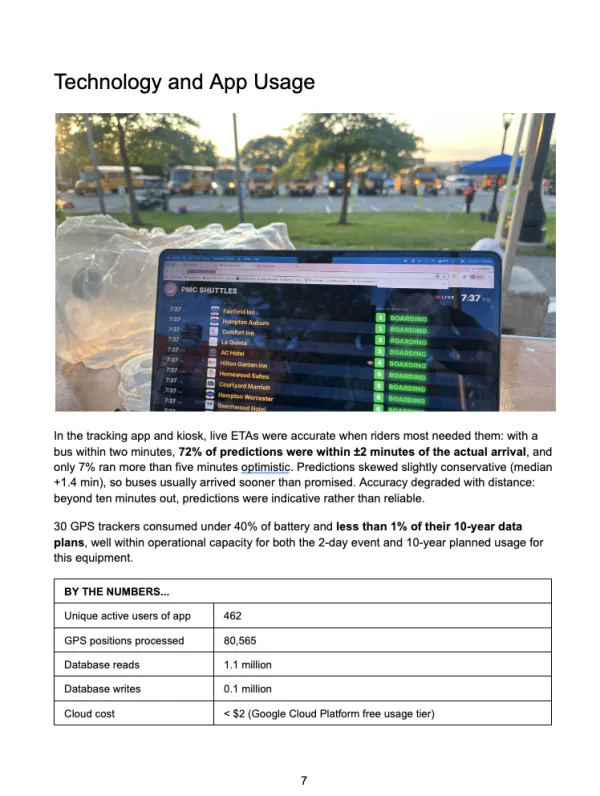
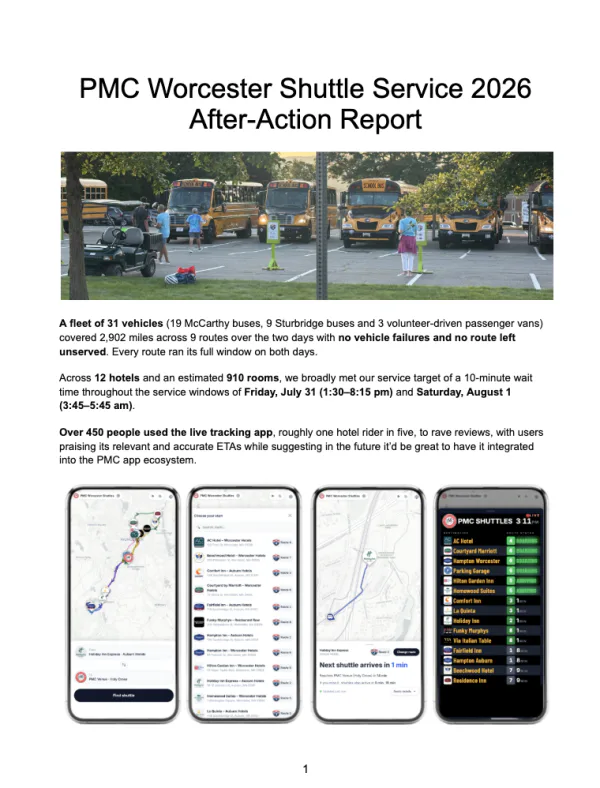
Wait and on-vehicle time, per route and per direction, as average, median, 90th and 95th percentile — so the worst experience is visible, not averaged away.
Pickup counts, first and last service times, headway between vehicles, dwell at each stop, and full round-trip times per route.
Distance, driving versus stopped time, average and maximum speed, battery consumption and break timing — per vehicle, per operator, per day.
How many vehicles sat at the venue over the day, split into boarding, queued behind another vehicle on the same route, and on break — with lot utilisation against capacity.
Your pre-event estimates scored against what happened, route by route, so next year’s plan starts from measured times rather than free-flow map estimates.
Every GPS position enriched with route, stop, and break status as CSV. Nothing is locked in the platform — it’s your event’s data.
What this found at a real event
One route accounted for nearly all of the poor experience on the busy day — and the same route corrected itself the next morning on identical staffing, proving the cause was traffic rather than too few vehicles. A second route carried zero passengers while occupying two vehicles for most of an afternoon. And roughly one vehicle in three sitting at the venue was queued behind another on the same route, adding nothing for anyone waiting across town.
None of those were visible on event day. All three were actionable findings worth more than the platform costs.
Proven in the field
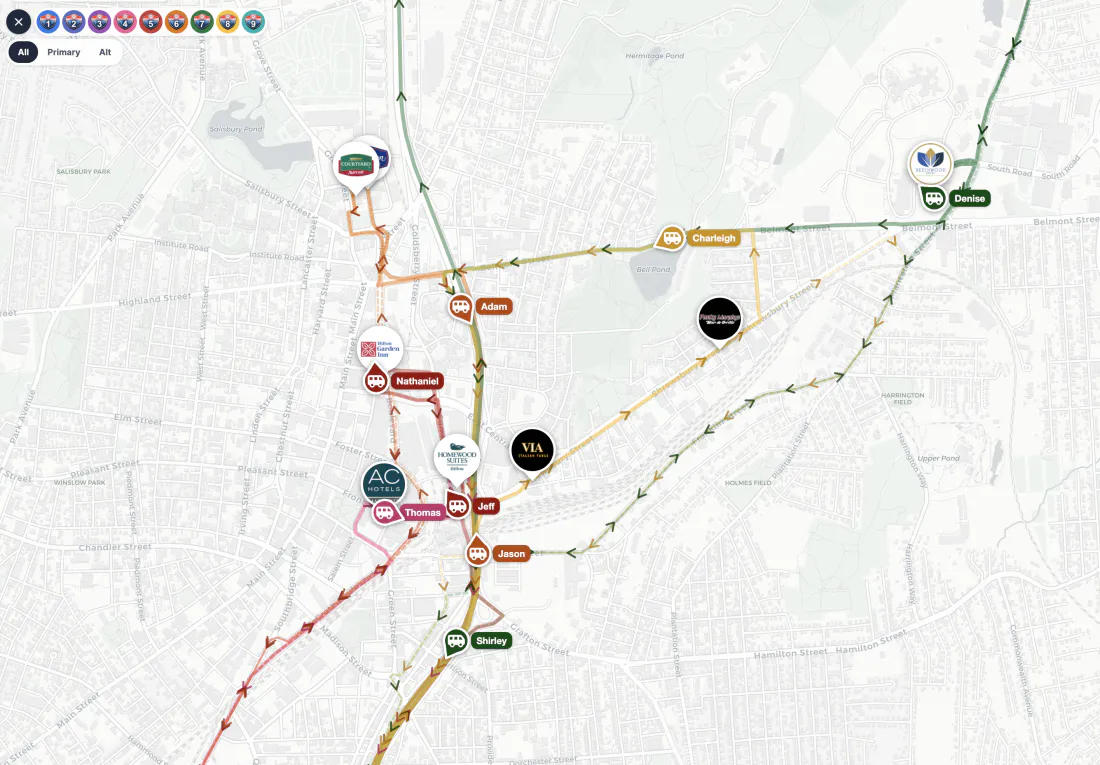
A two-day charity cycling event: 12 hotels, ~910 rooms, nine routes, a parking garage shuttle, and a Saturday morning where every rider had to reach the start line before dawn.
Saturday service ran 3:45–5:45 a.m., when a missed shuttle means a missed start. Every route came in under 7.5 minutes average wait. Five of seven routes ran a final pickup within four minutes of the published close.
Who it’s for
The value is highest when people can’t see the shuttle coming, don’t know the area, and can’t afford to miss it. That describes three kinds of event particularly well.
Riders spread across a dozen hotels, a fixed departure they cannot miss, and a volunteer operations crew that changes every year. The exact shape this platform was built for.
Pan-Mass Challenge · Bike MS · Tour de Cure · Ride to Conquer Cancer
Transition closes at a fixed time and an athlete who misses it forfeits a year of training. Shuttles run from 4 a.m., often every 15 minutes, from hotels and remote park-and-ride lots.
Ironman & 70.3 · marathon majors · destination triathlons
The many-origins-to-one-destination pattern at its largest, with attendees who don’t know the city, on multi-day schedules, where shuttle quality shapes the whole impression of the event.
Trade shows & conferences · music festivals · citywide conventions
If everyone starts from one parking lot and can see the queue, you don’t need this. If they start from twelve hotels across two towns and the first wave leaves at 3:45 a.m., you do. — The qualifying test we apply before quoting
Pricing
Priced per event — not per year, per vehicle, or per passenger. What you pay turns on how many routes you run, and nothing else.
A route is the unit of setup work: stops and geometry, timing calibration, signage, QR deep links, driver handbooks and crew schedules. Vehicles are free — run as many on a route as you like.
Own trackers already? They work as-is — many models supported, nothing to buy from us. Need them for one weekend? Rent them, configured and charged, and send them back. Want to keep them? We source the right model and you buy at cost.
Here’s a planning range you can take to a committee (not a quote).
Events like yours typically are priced at
—
for the entire event, up to 7 days.
Why not a fleet-tracking subscription
Conventional telematics is built for vehicles you own, on annual routes, under multi-year contracts. An event is the opposite of all three.
| Enterprise fleet telematics | Budget no-contract trackers |  |
|
|---|---|---|---|
| Passenger-facing app & ETAs | None — operator dashboard only | None | Purpose-built, with a predictive ETA engine |
| Commitment | Typically 3 years, early-termination fees | Month to month | A single event. Nothing auto-renews. |
| Your own GPS hardware | Proprietary devices only | Their devices, usually OBD-II plug-ins | Bring your own, or rent ours for the event |
| Chartered coaches | Needs vehicle access and installation | OBD port access you won’t get on a charter | Self-powered units, no vehicle modification |
| Event operations tooling | Not applicable | Not applicable | Signage, kiosks, handbooks, crew schedules |
| Post-event analysis | Generic fleet reports | Trip history export | Full analytics suite & written after-action report |
| Pricing model | $20–45 per vehicle, per month + activation and other fees | $14–20 per vehicle, per month + activation and other fees | Flat fee per event — vehicles never metered |
Fully covered Most of the way Partial Minimal Not offered
Comparison reflects publicly advertised terms for widely used fleet-tracking products; specifics vary by vendor and quote.
Next step
Send us your hotel list and venue, and we’ll build a working route map for your event — then walk you through the passenger app, the dispatch console and a real after-action report.
Typical onboarding is a few weeks from route data to a live passenger app.